Fire Hall Response Time Analysis in Seven Municipalities in the Greater Vancouver Regional District
How Population Increase Affects the Service Areas
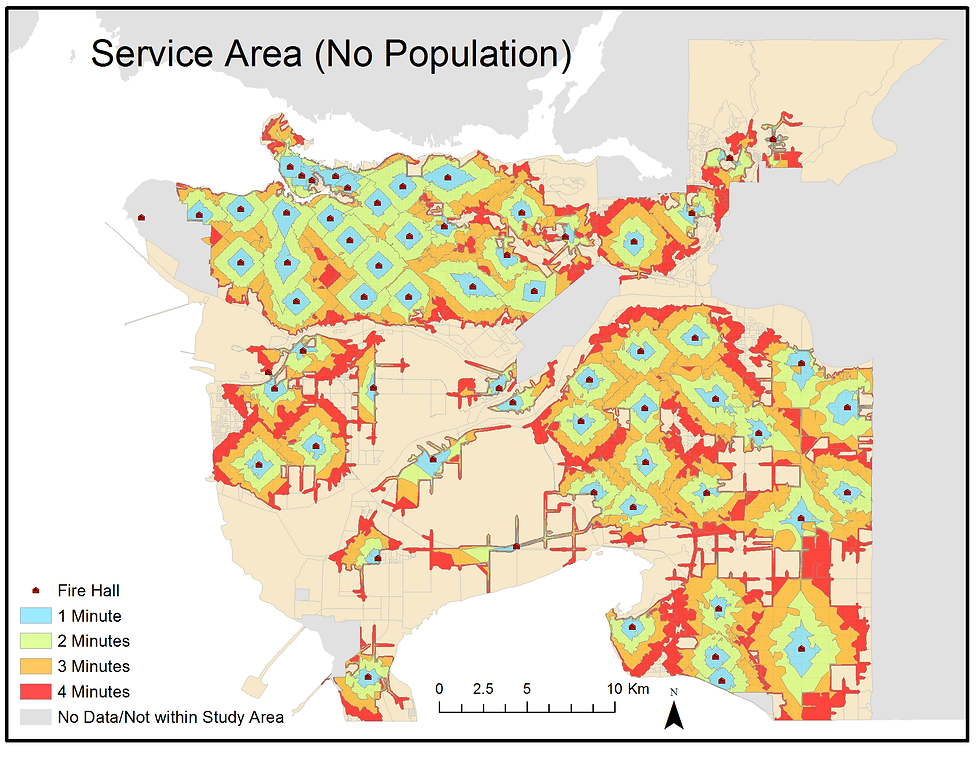
Service Area 1
Service area by the international standard time of 4 minutes.
The map shows the response time coverage extent of each fire hall in the study area in 1, 2, 3 and 4 minute time intervals.
This map does not take into account population density.
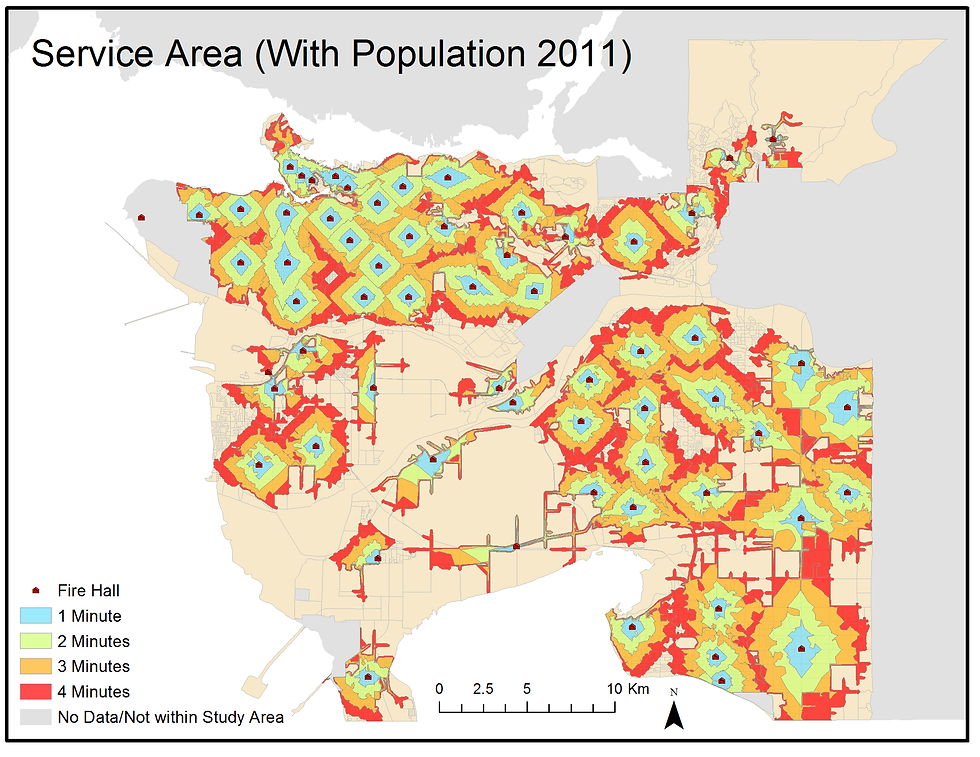
Service Area 2
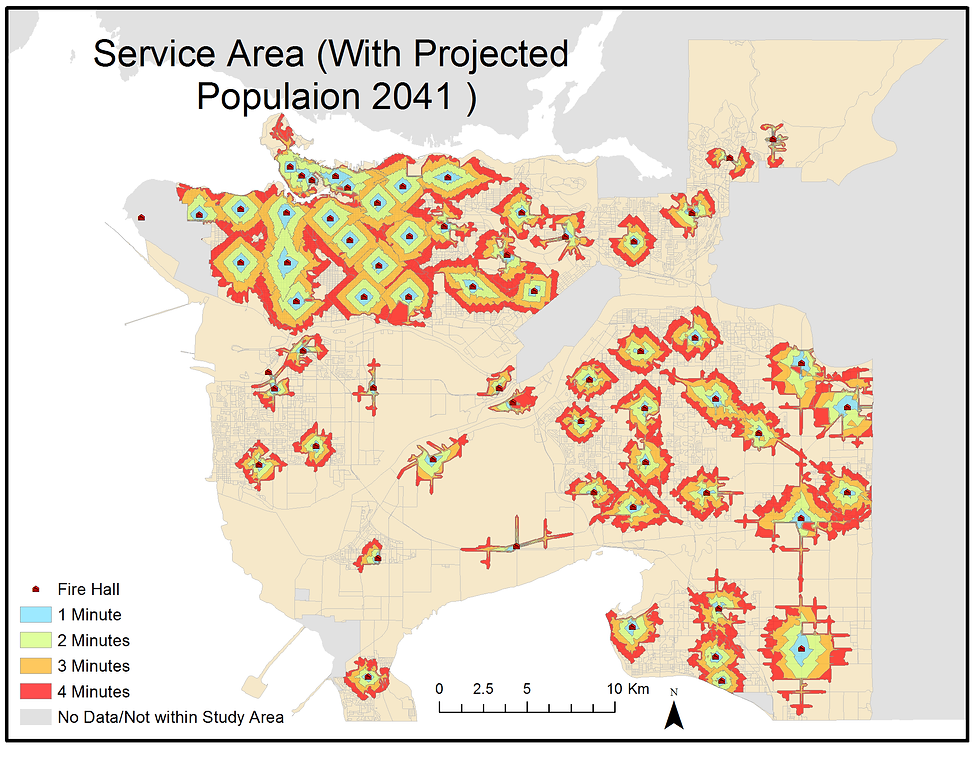
Service Area 3
After taking into account the population density in 2011 and how it affects the travel times, this is the new service area map.
The service areas shrink slightly and are largely affected by the population density. Thus we see city like Vancouver, which has a higher population density, has its service areas change the most (although this change is still minimal). We could see that there are more of the red (4 minute) service area in this map compared to the previous one.
With the projected population in 2041 taken into account, this is the new service area. We see that the study area in most places shrinks significantly.
Vancouver remains well covered, while places like Surrey, Richmond and Coquitlam, has much of their area uncovered by the standard 4 minutes. This could be problematic because these areas are projected to experience the most population increase. A more detailed discussion of our results can be found in our ‘Discussion’ section.