Fire Hall Response Time Analysis in Seven Municipalities in the Greater Vancouver Regional District
How Population Increase Affects the Service Areas

What the maps in our ‘Results’ section show are how the service areas around the fire halls in our study area change as population increases and ultimately increases the travel times along the road network. Service Area 1 shows the coverage when population is not considered and simply the average travel time for each road segment is used. Service Area 2, by contrast, shows the service areas when population according to the 2011 Canadian Census is considered. In this scenario, travel times were multiplied based on our classification of low, medium and high population densities at the dissemination block level in each municipality. The difference between these two maps is not significant except in small areas where the extent of the four-minute service areas is minimally reduced. This is simply due to the low multiplying factors we used as mentioned in our ‘Methodology’ section.
The most significant difference can be clearly seen in
Service Area 3 where we consider the projected population in 2041. In this scenario we multiplied the travel times from Service Area 2 by a factor that was equal to the per cent change in population for each municipality (see Figure 1 below for the multiplying factors). In every municipality except Vancouver, which only lost coverage in one relatively small area, many large areas lost coverage. Richmond (24.5% in 2011 to 77.0% in 2041), Coquitlam (34.7% in 2011 to 72.7% in 2041), Surrey (7.8% in 2011 to 44.5% in 2041) and Delta (12.0% in 2011 to 60.8% in 2041) in particular lost the most. For the first three, this is troubling because these municipalities are projected to experience the most population increase by 2041 (44%, 77% and 58% respectively). Burnaby is among these as well (55% population increase by 2041) and, though the number of people who will be outside the service area will not increase as dramatically as the others (5.8% in 2011 to 24.6% in 2041), it too will experience a significant change. Delta and White Rock will experience population increase at lower rates, 23% and 40% respectively, but both will lose a considerable amount of area within the service area, Delta significantly (12.0% in 2011 to 60.8% in 2041). A summary of population change and per cent change in the number of people covered by the service areas can be seen in Figures 2 and 3 below.
The reason the service area is so significantly reduced in the 2041 population scenario is undoubtedly due to the higher multiplication factors we used. This is potentially problematic as explained in our ‘Uncertainty’ section below. In terms of why Delta loses so much area despite only experiencing a modest population increase of 23%, this could be due to another factor other than the altered travel times of the roads. It could have something to do with the road network design (see ‘Areas for Further Research’ below), or perhaps where the current population densities are higher and where the growth will occur (see ‘Uncertainty’ below). These factors would affect the service areas in any of the other municipalities as well but an analysis of these factors fall outside of our objective for this project.
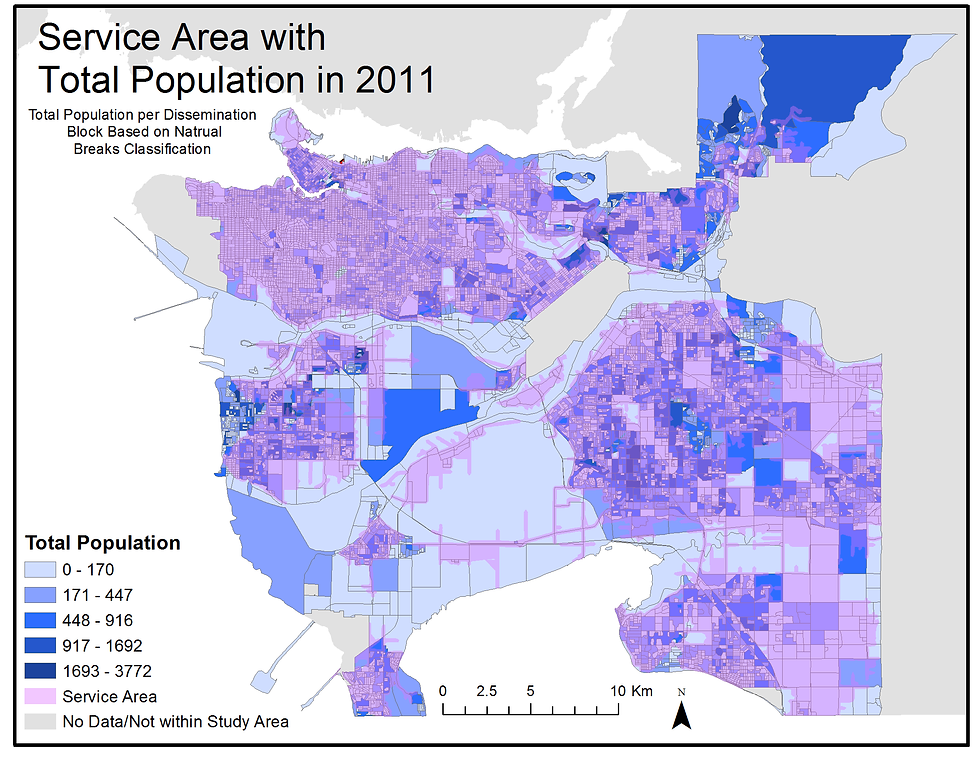
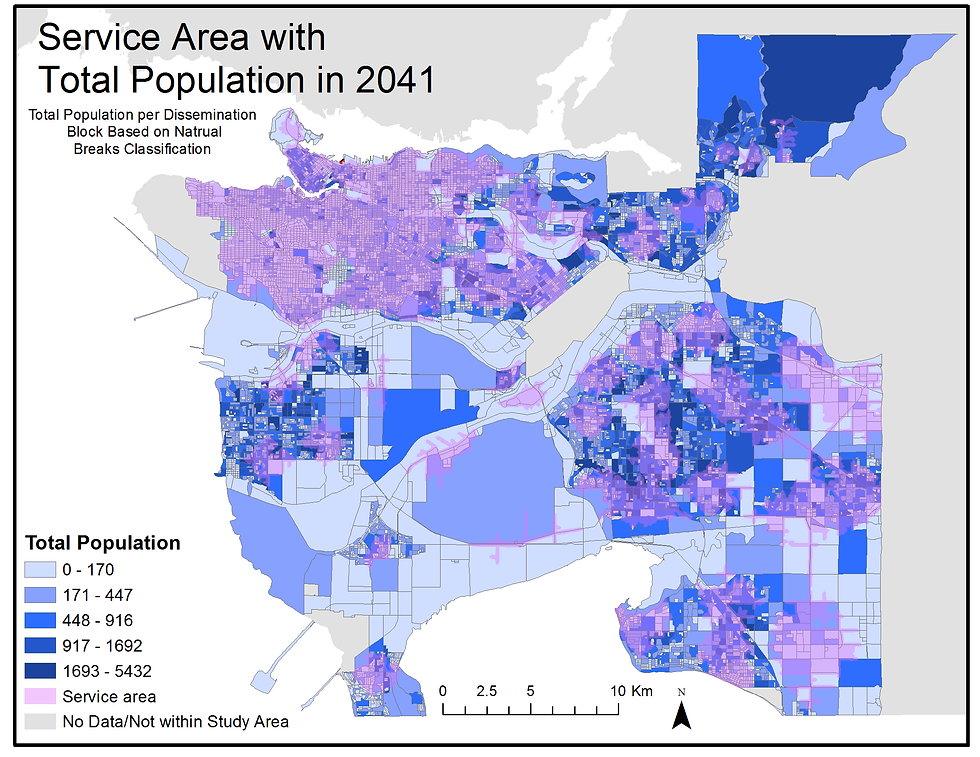
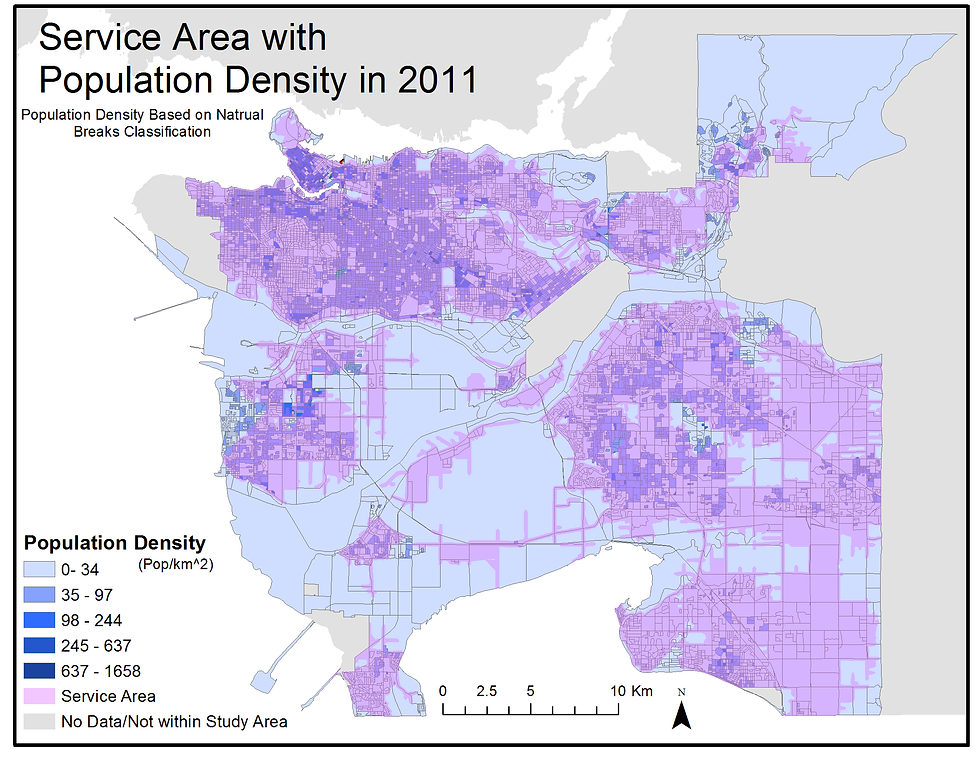
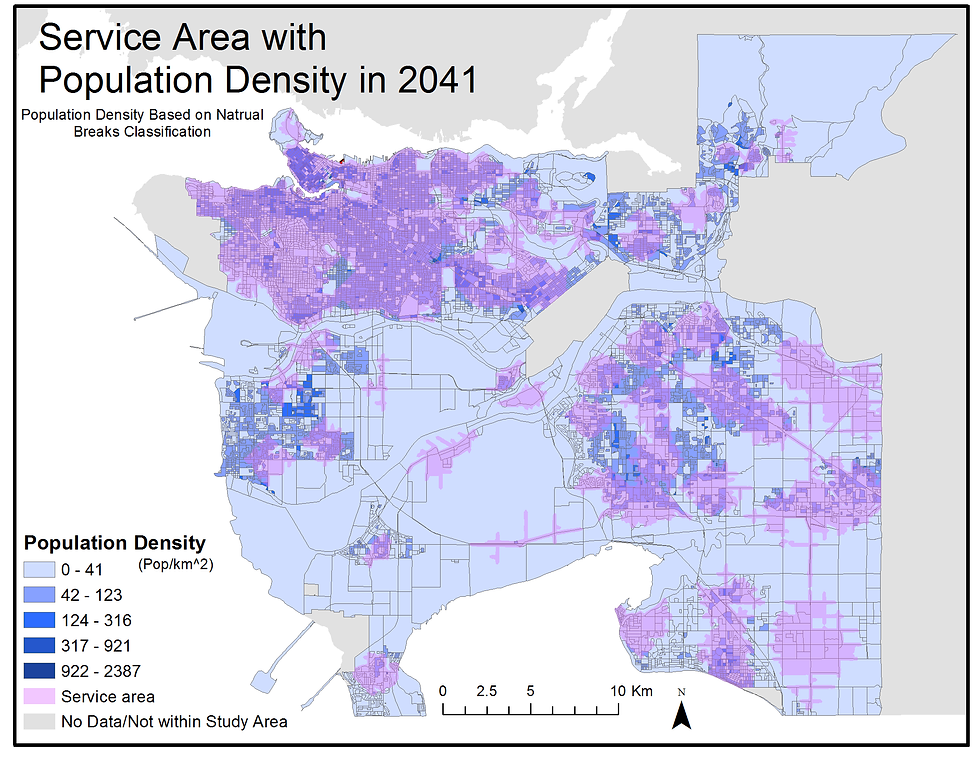
For the most part, areas that are outside of the service areas are present because there are no roads leading into those places. This may be because these areas are farmland, open area or some other land use type. This is particularly apparent in Delta where the service area is clearly confined to the corridors of the few roads that are present there. There is also vast parkland in the North of Coquitlam and certain areas of Richmond along with small pockets of land in Surrey that are farmland areas. However, as seen in the Total Population and Population Density maps for both the 2011 and 2041 scenarios, it is clear that with population increase in the next few decades, some areas, mainly in Coquitlam, Richmond and Surrey, where population increase is projected to be the highest, will be outside the four-minute response time. By 2041, these three municipalities, along with Delta, will have nearly, in Surrey’s case, and over in the others’ half of the population living outside of an appropriate fire response area. It appears that Vancouver’s coverage will only be reduced slightly and this could be due to the number and strategic location of its fire halls. Surrey has plenty of fire halls itself and though their placement may not be as strategically beneficial, the main difference is the very high population increase and the effect this has on the travel times.
From our analysis, it becomes clear that with population increase, road network travel times also increase and ultimately emergency response is slowed. With our results, it’s clear that some municipalities in the GVRD will have to make some serious decisions in the coming decades on how to mitigate the inevitable loss of coverage by their fire halls and to eliminate the risk of not being helped in a timely manner that the people who live in these areas will ultimately face.
Uncertainty
Conclusion
Due to double lanes of certain streets in the road system, we were unable to create service areas, in all three cases, around several facilities (such as fire halls on 199 Main St, 1090 Haro Street, 895 Hamilton St and 775 Marine Way). As a result, these facilities were dragged to the nearest available intersections and new service areas were created. Indeed, the new service areas are slightly different from the original areas.
Census data at the dissemination block level is suppressed when the population in a block is below 15. This is done in order to maintain confidentiality and the privacy of those that live there; therefore, our population numbers, though close, are not quite 100% accurate.
As outlined in our methodology, we reclassified the population densities into low, medium and high classes which we then used to recalculate the travel times of the road network. These classes are somewhat arbitrary and are loosely based upon Demographia (2009). Changing these class ranges may potentially result in different service areas. The multiplication factors we used when recalculating the travel times could also be different, which would ultimately alter the service areas as well.
In our analysis, we also assumed that population increase was homogenous throughout each dissemination block. This may not be completely accurate in all blocks since some may have open area, parks or other land use types where people do not live. We also adopted the method of Brinklow et al (2006) in that, as population increases by a certain per cent, the travel times of the roads within each area will also increase by that same per cent. This is problematic because again, the per cent population increase is an average for the entire municipality and does not reflect areas that may increase at much higher rates or areas that could potentially lose people to out migration or other factors. Another aspect of this issue is that when erasing the service areas from the seven municipalities, some dissemination blocks were only partially erased but the piece that remained still contained the population total as if it hadn’t been divided. It is possible that the piece that remained, in reality, had only a fraction of the original population, thus our calculations for the number of people who will not be within the four-minute service area are in some cases a simplified result.
Other limitations of our analysis include the lack of actual traffic data. This could have been a more detailed and precise method to implement when creating and altering our service areas, especially for the major roadways throughout our study area. We also assume that the fire halls will remain where they are in 2041 and we do not take into account possible technological advances in fire service equipment. We also assume that fire service demand is homogenous throughout the study area. While high rise or multi-unit dwellings may have more demand than single family homes, we assume that all building types share the same risk. It should also be noted that the municipalities to the West of Coquitlam that are outside of our study will undoubtedly have their own fire halls that may be able to reach some of the areas that are shown to be outside of the four-minute service area. A more complete assessment that includes the other municipalities in GVRD could potentially clear this up.
Discussion
There are a few ways in which this project could be expanded and improved upon. First, further analysis could provide suggestions for locations of new fire halls or potential relocation sites in order to maximize the service area coverage across the study area. Second, a detailed analysis of the road network design in each municipality could be conducted to see if this has an impact on travel times. Looking at current traffic data could also improve the travel time calculations, especially along the major road ways that are congested for several hours each day. Finally, including the other municipalities in the GVRD would create a more comprehensive study of the Lower Mainland of British Columbia.

From our analysis we have created service areas that represent the area, based on one, two, three and four-minute time intervals, that fire halls in select municipalities in the GVRD can cover. We have shown how these service areas are altered when considering population densities at current (2011 Census) levels and at projected 2041 population levels. We have also identified the areas that will be most affected in terms of fire response coverage due to population increase in the coming decades. Although there are some sources of uncertainty and parts of our methodology were generalized and somewhat simplified, we believe we have been successful in our objective and our methods show some interesting, and in some areas concerning, results.

Area for Further Research